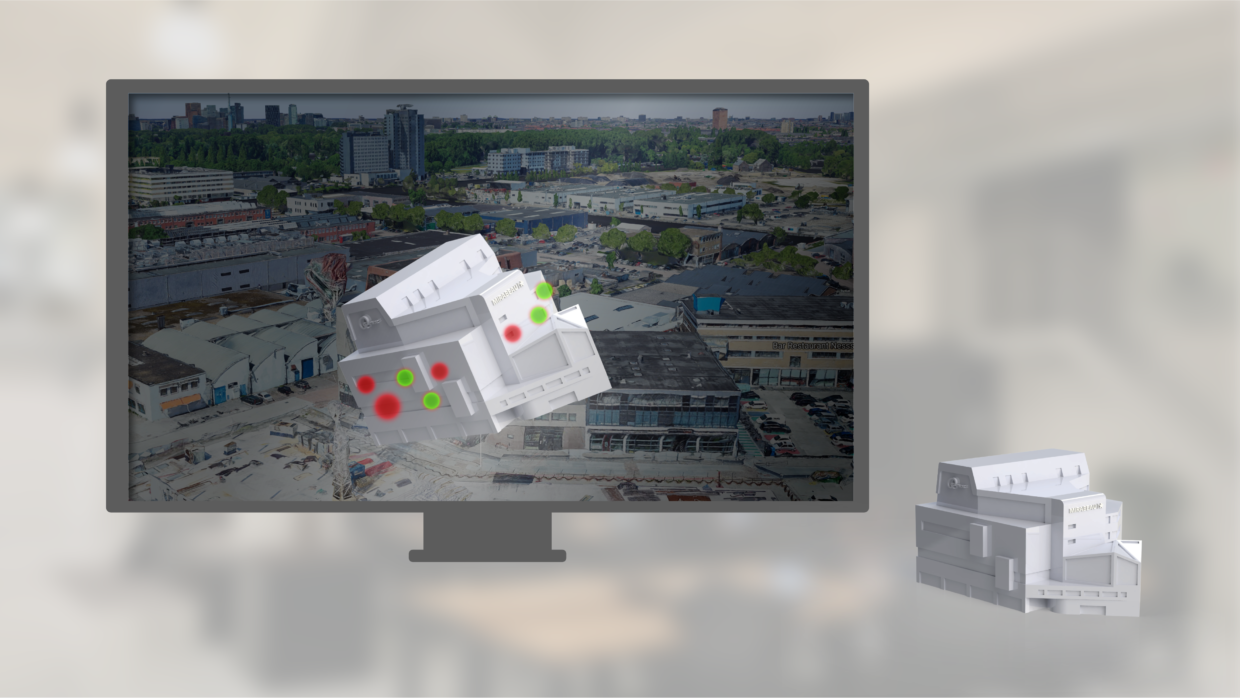
Sometimes data cannot be easily read through graphs, lists or maps. Sometimes we need 3D. That’s why we mapped our climate sensor data onto a realtime 3D model. To control this ‘digital twin’ we also created a physical controller, shaped after our office building (KBF). This is the KBF-controller.
Please note: I wrote this article and created its materials for Mirabeau. Some materials might be co-created. The results and projects are always done in a team.
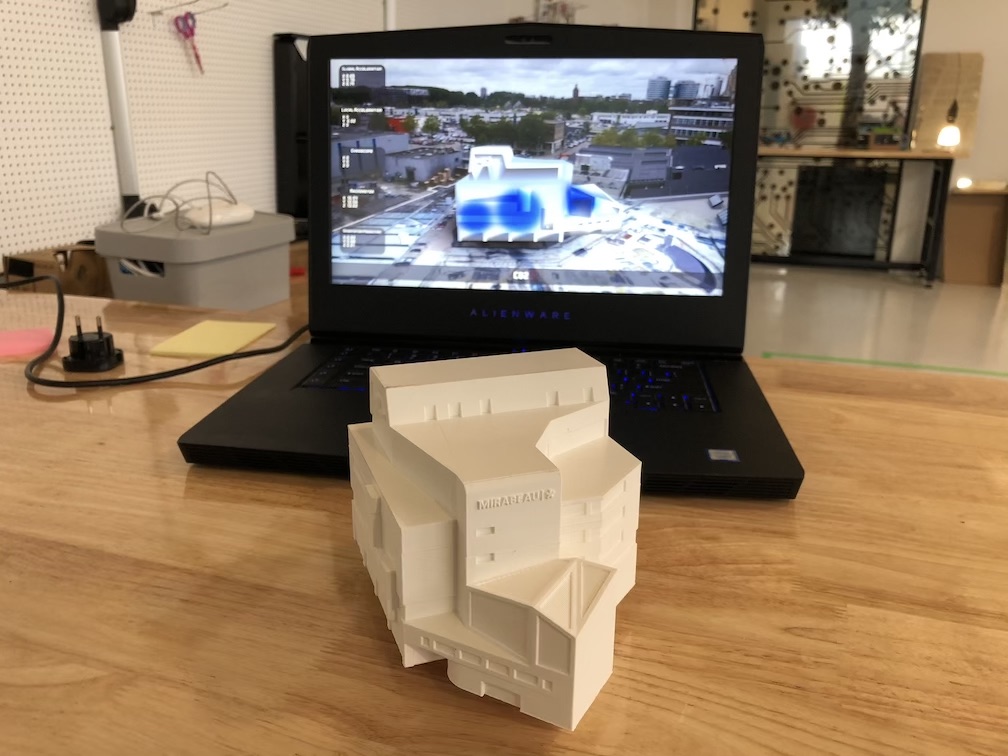
One of the hardest things about the sensor data of our smart building project is to make the information relatable, intuitive and accessible. We needed the data to be part of the building, rather than just a reading from a list.
Quickly see the realtime health of our building
We wanted to show if it’s too hot in a specific room, where that room is and how the room and it’s temperature relates to the environment within the building and to other sensorial data. With use of the controller we are now able to control and select the data-layer we want to see and have quick insights into the current health of our building..
Introducing: 3D data building with the KBF-Controller
To rotate and pitch the 3D model and the represented data on the screen we needed a controller. Because the data was about our Amsterdam HQ, we thought it would be cool to also make the controller look like our office “Kauwgomballenfabriek”.
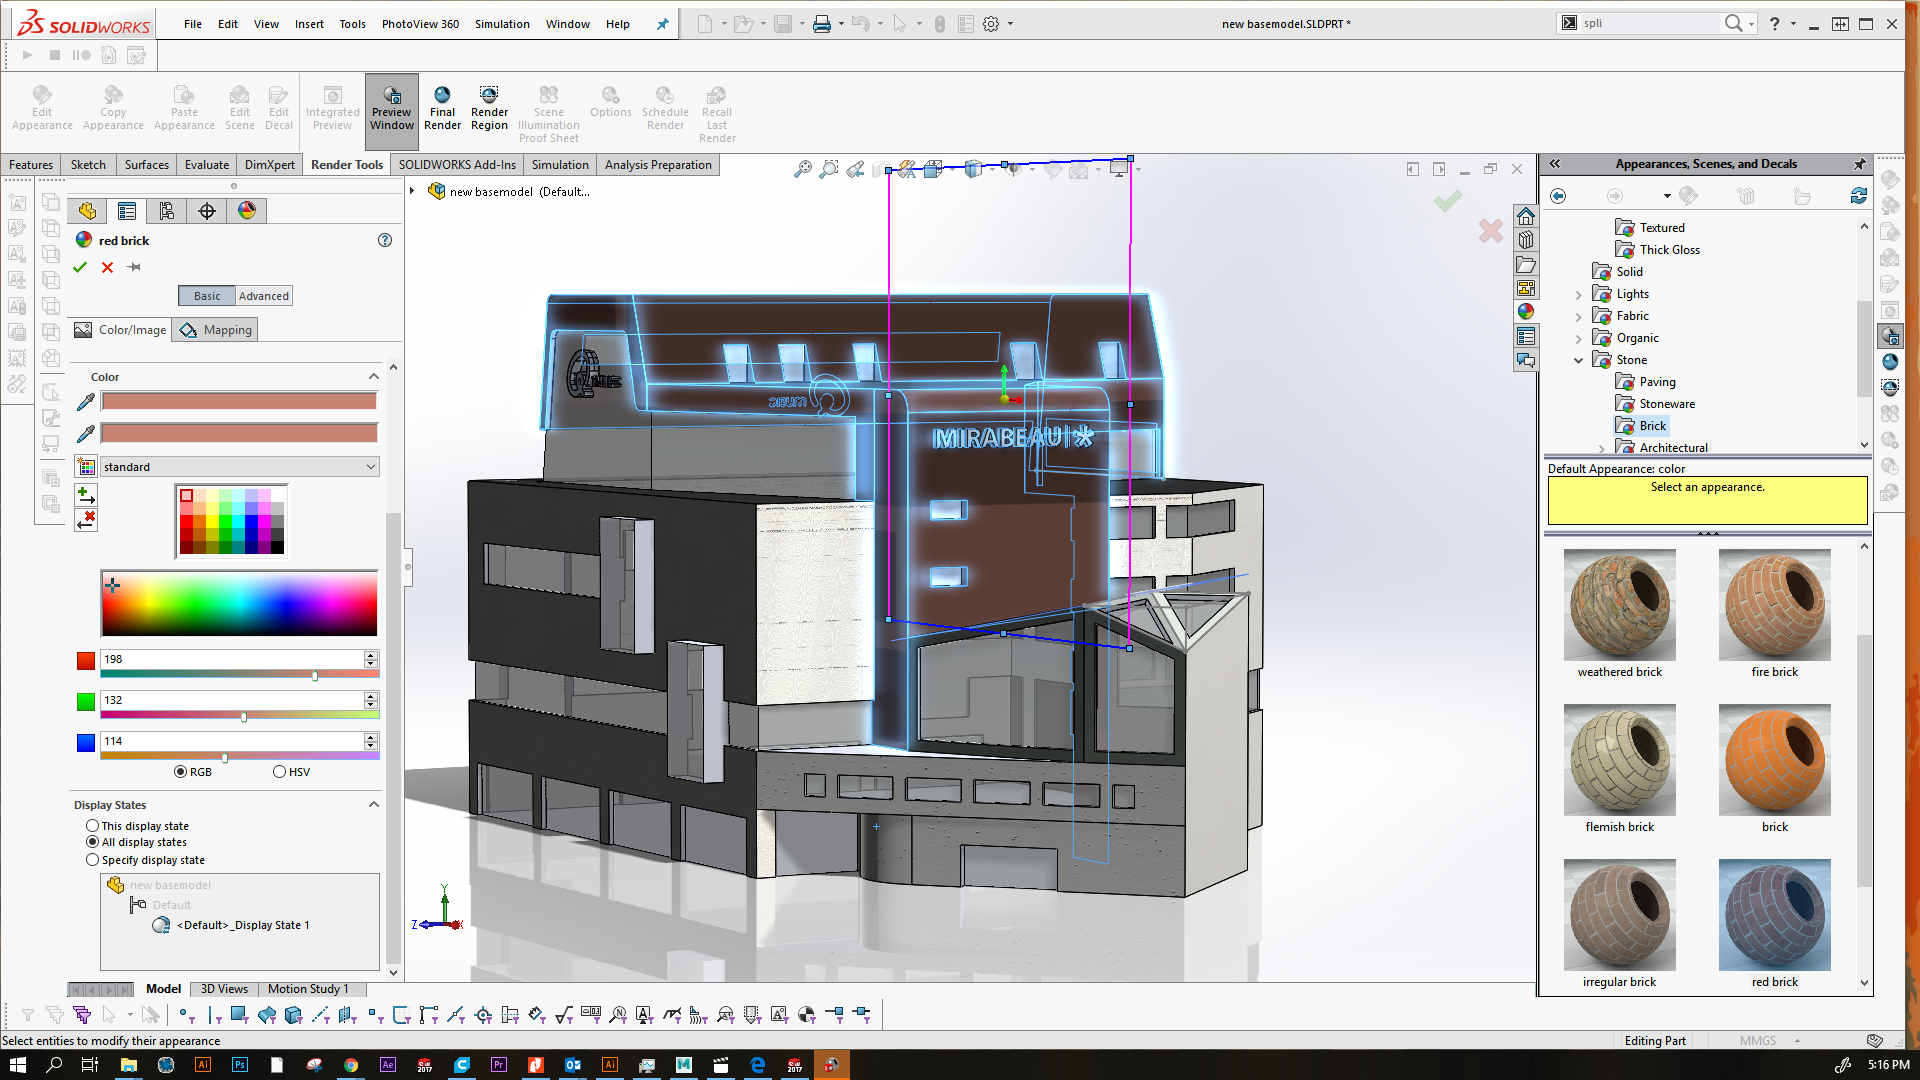
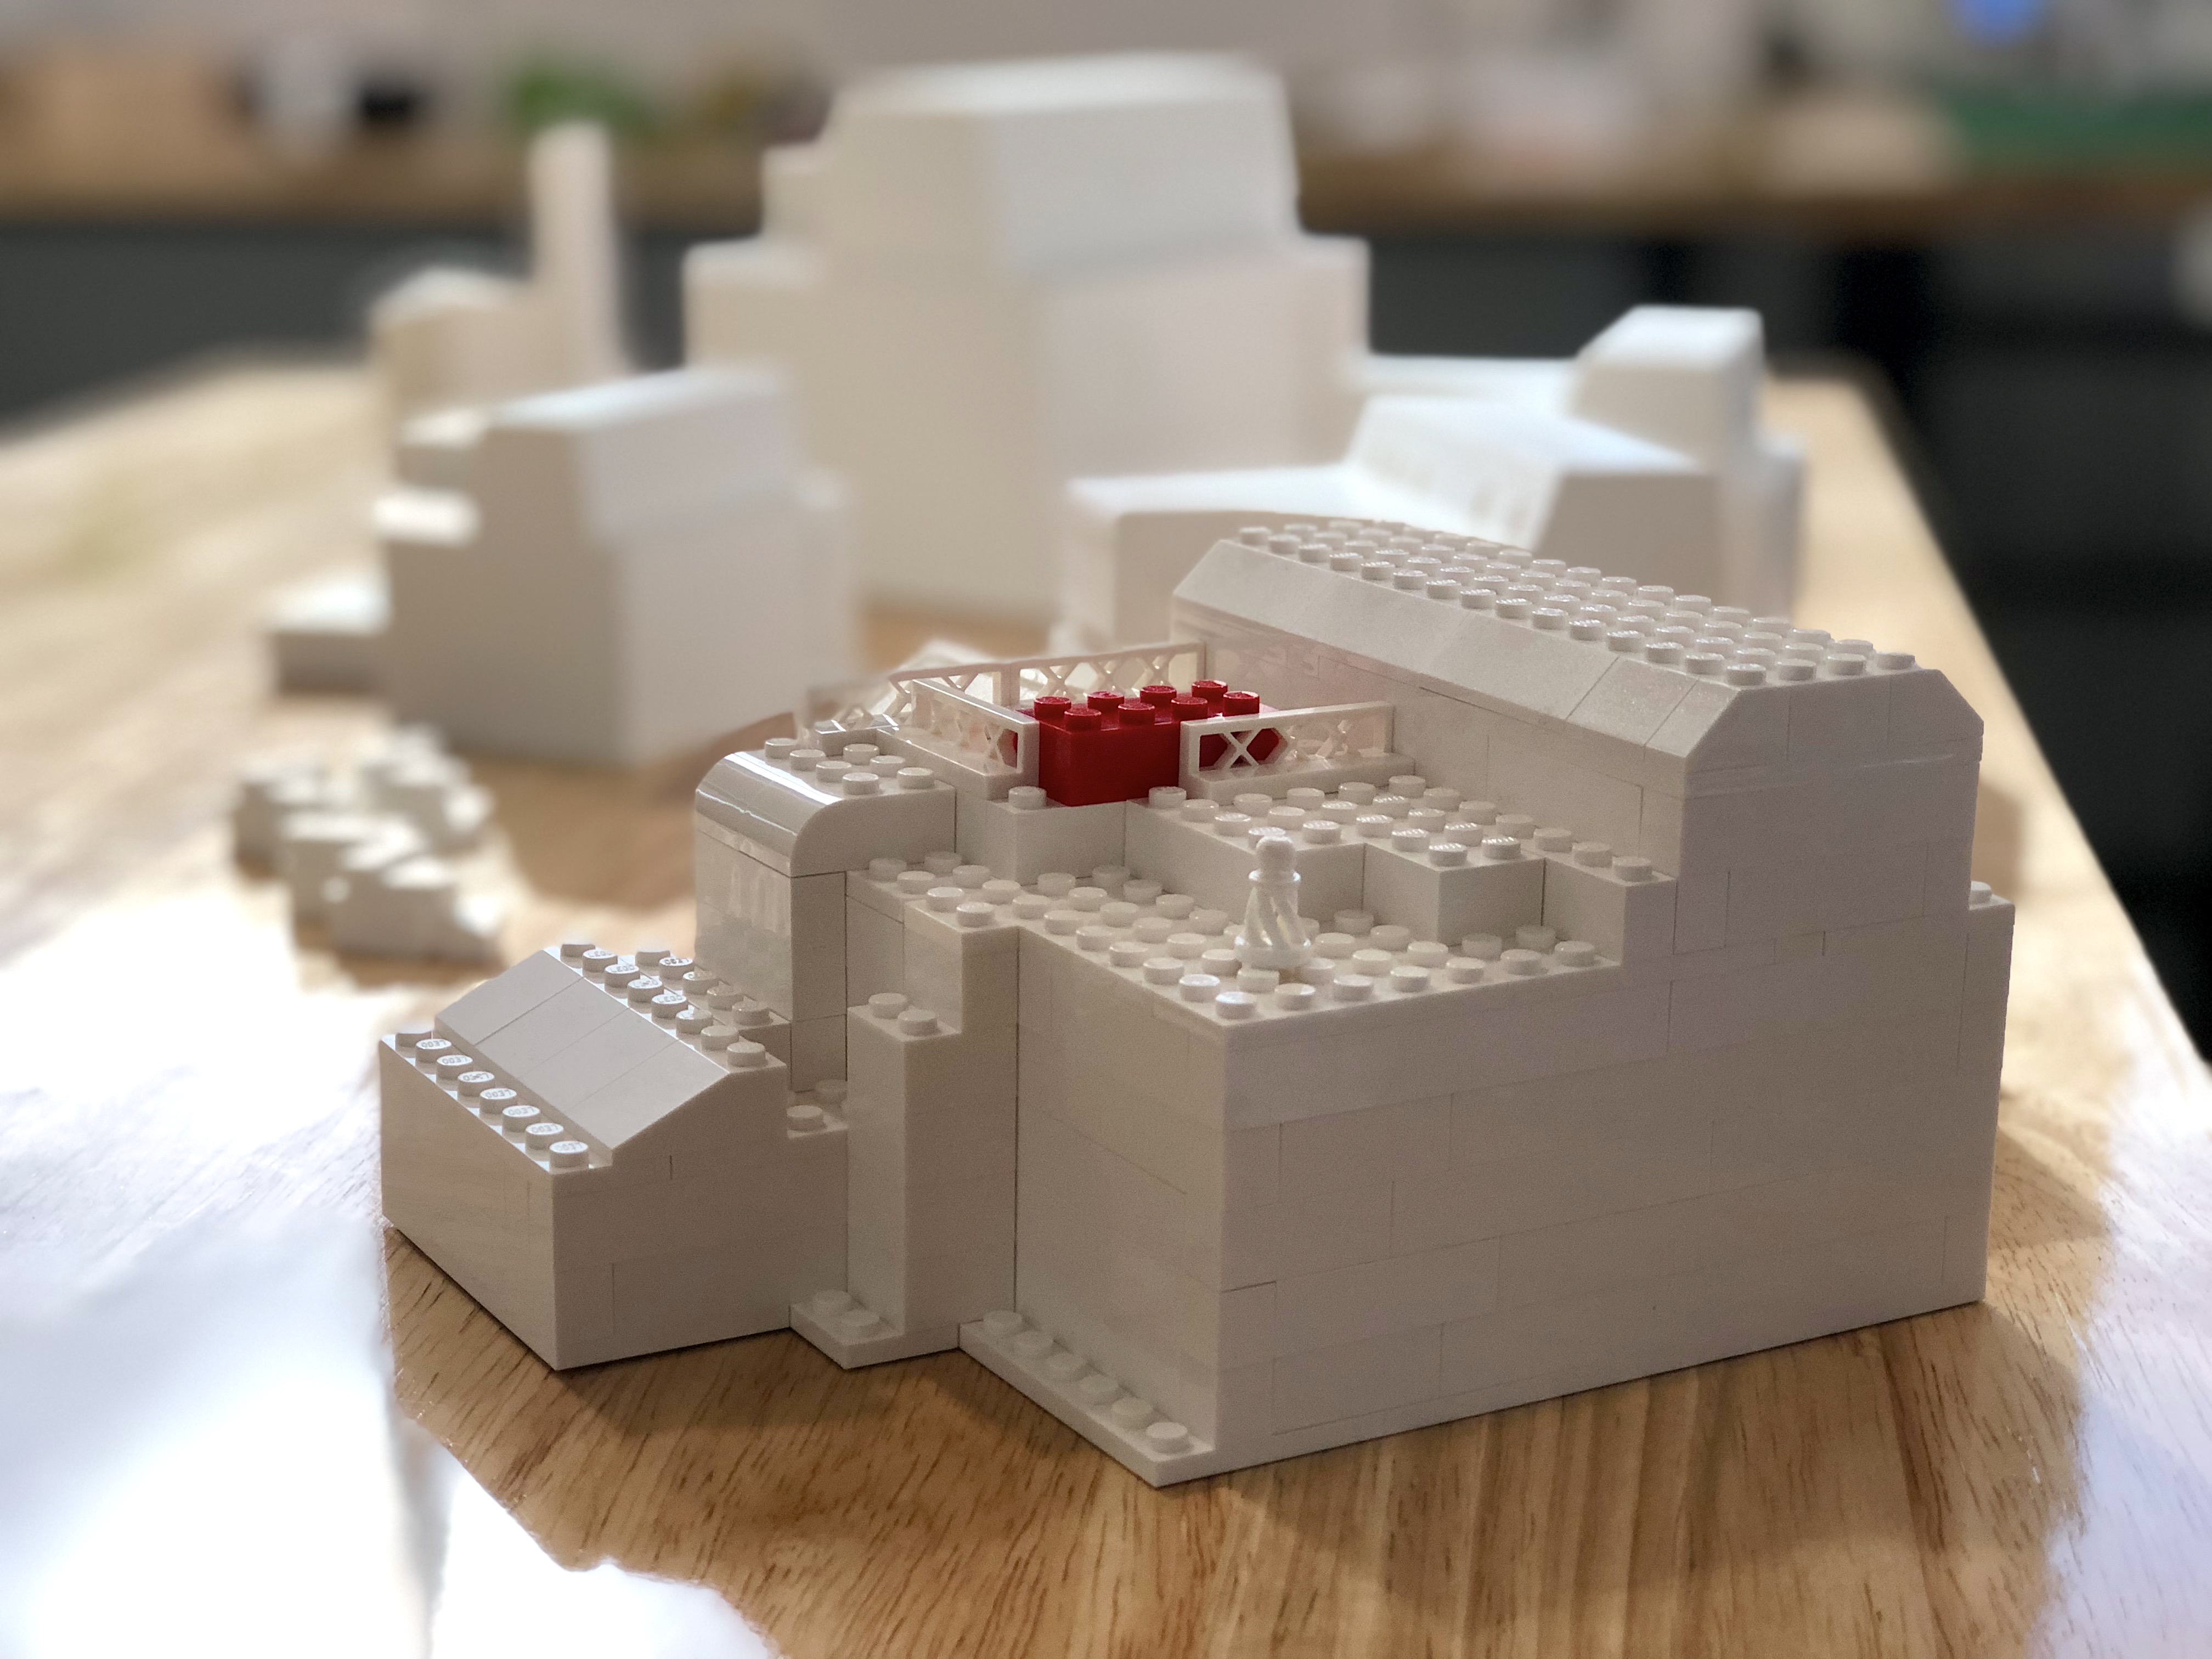
So we 3D printed an incrementally more finished model of our building. First we used Lego bricks to get a feel of size and weight and after finalizing the 3D model, we started embedding and programming sensors, processors and software to make the controller actually control the 3D model on the screen.
Make our data move …. in 3D!
To make the screen 3D model move in synchrony with the physical version we used a gyroscopic (IMU) breakout board. This board creates a stream of movement data. Every time the KBF-Controller moves, it creates data for the screen-model to move. That data is sent to the 3D presentation on screen using a local Wifi hotspot running inside the physical model. With use of an Arduino MKR1000 module and a battery we made the controller completely wireless.
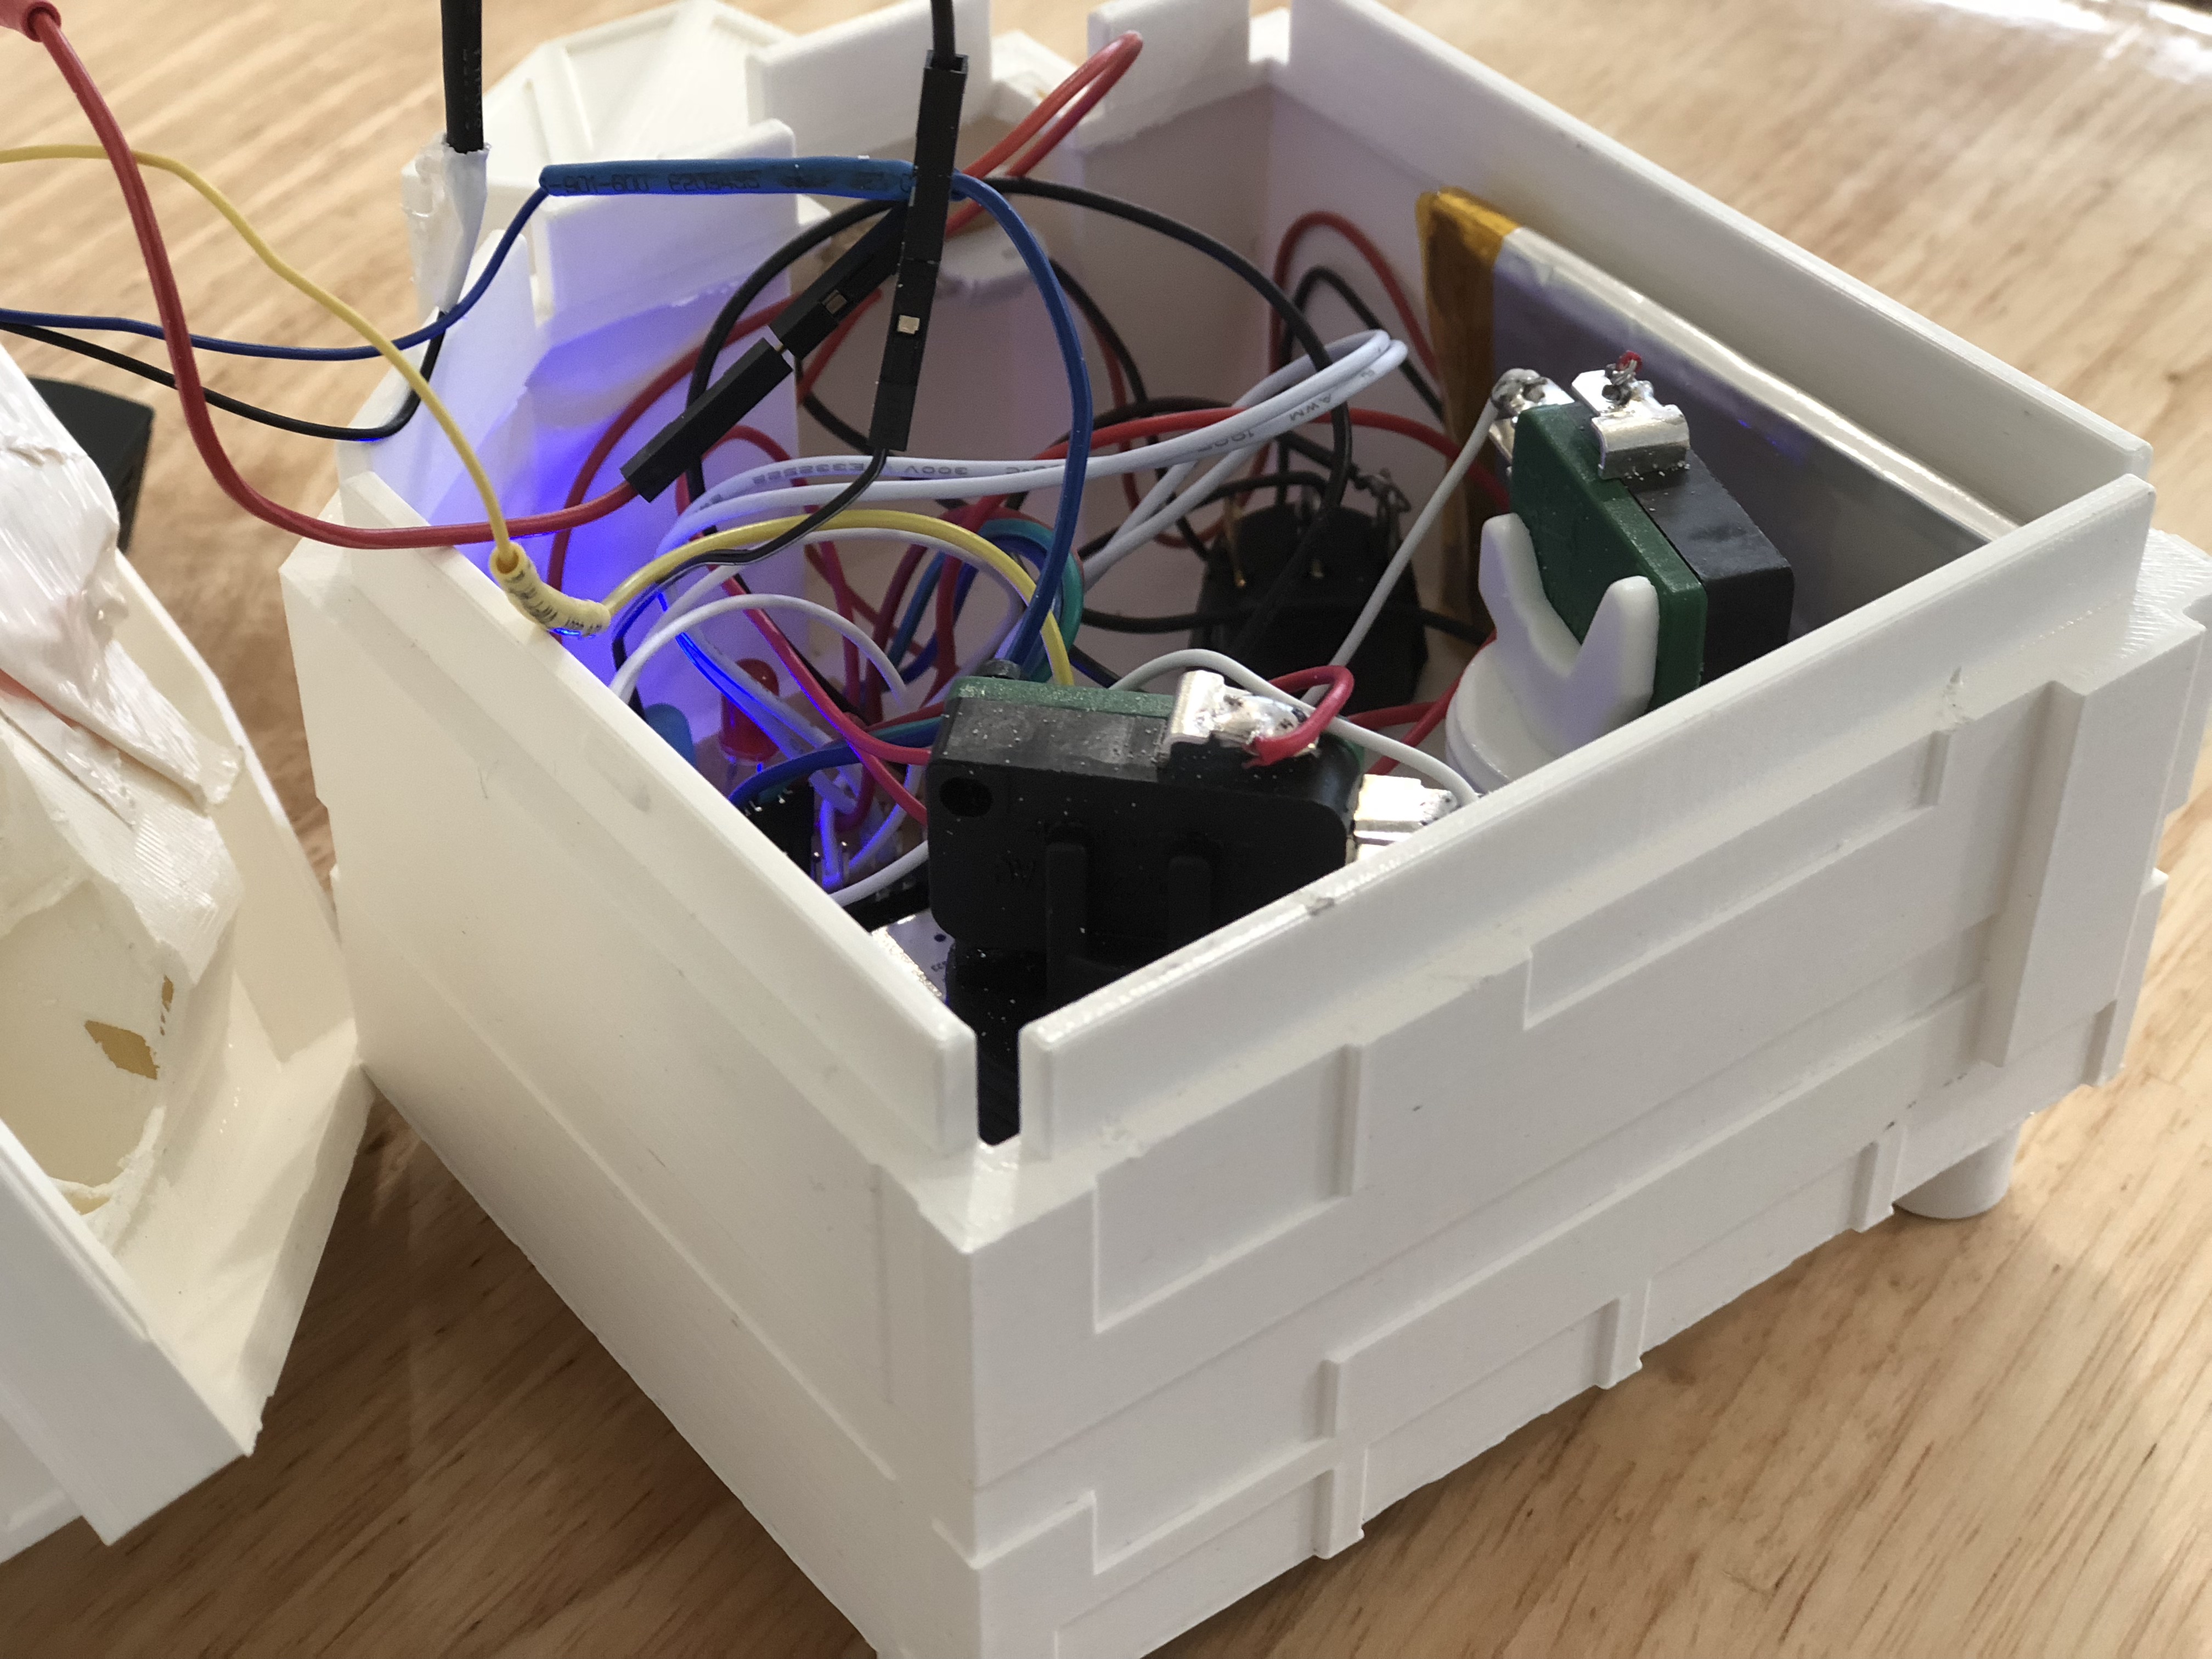
Since the gyroscope mainly talks about the changes since the previous seconds, it can drift a little bit, that’s why we also implemented buttons to switch the view, but also reset the position and add a little fun to the experience.
Next steps
Exploring and combining new tools and media like physical controllers and 3D data visualization is a corner stone of our innovation program. We are committed to learn and translate those learnings to concrete spin offs for our clients to build upon with our teams. Be it climate control, or data visualization.
In this case, combining different technologies like 3D modelling, implementing IoT electronics and data visualization techniques we made a different kind of interface, showing future possibilities of bringing data to life.
Right now we’re considering Augmented Reality layers to discover and visualize data onto the real world, or physical 3D models. Imagine walking around in a building and literally see all the sensor data, telling you current conditions and deviations. With these techniques there are a lot of new ways to explore to provide insights and discover the value it can add to different professions. Stay tuned for new updates.
