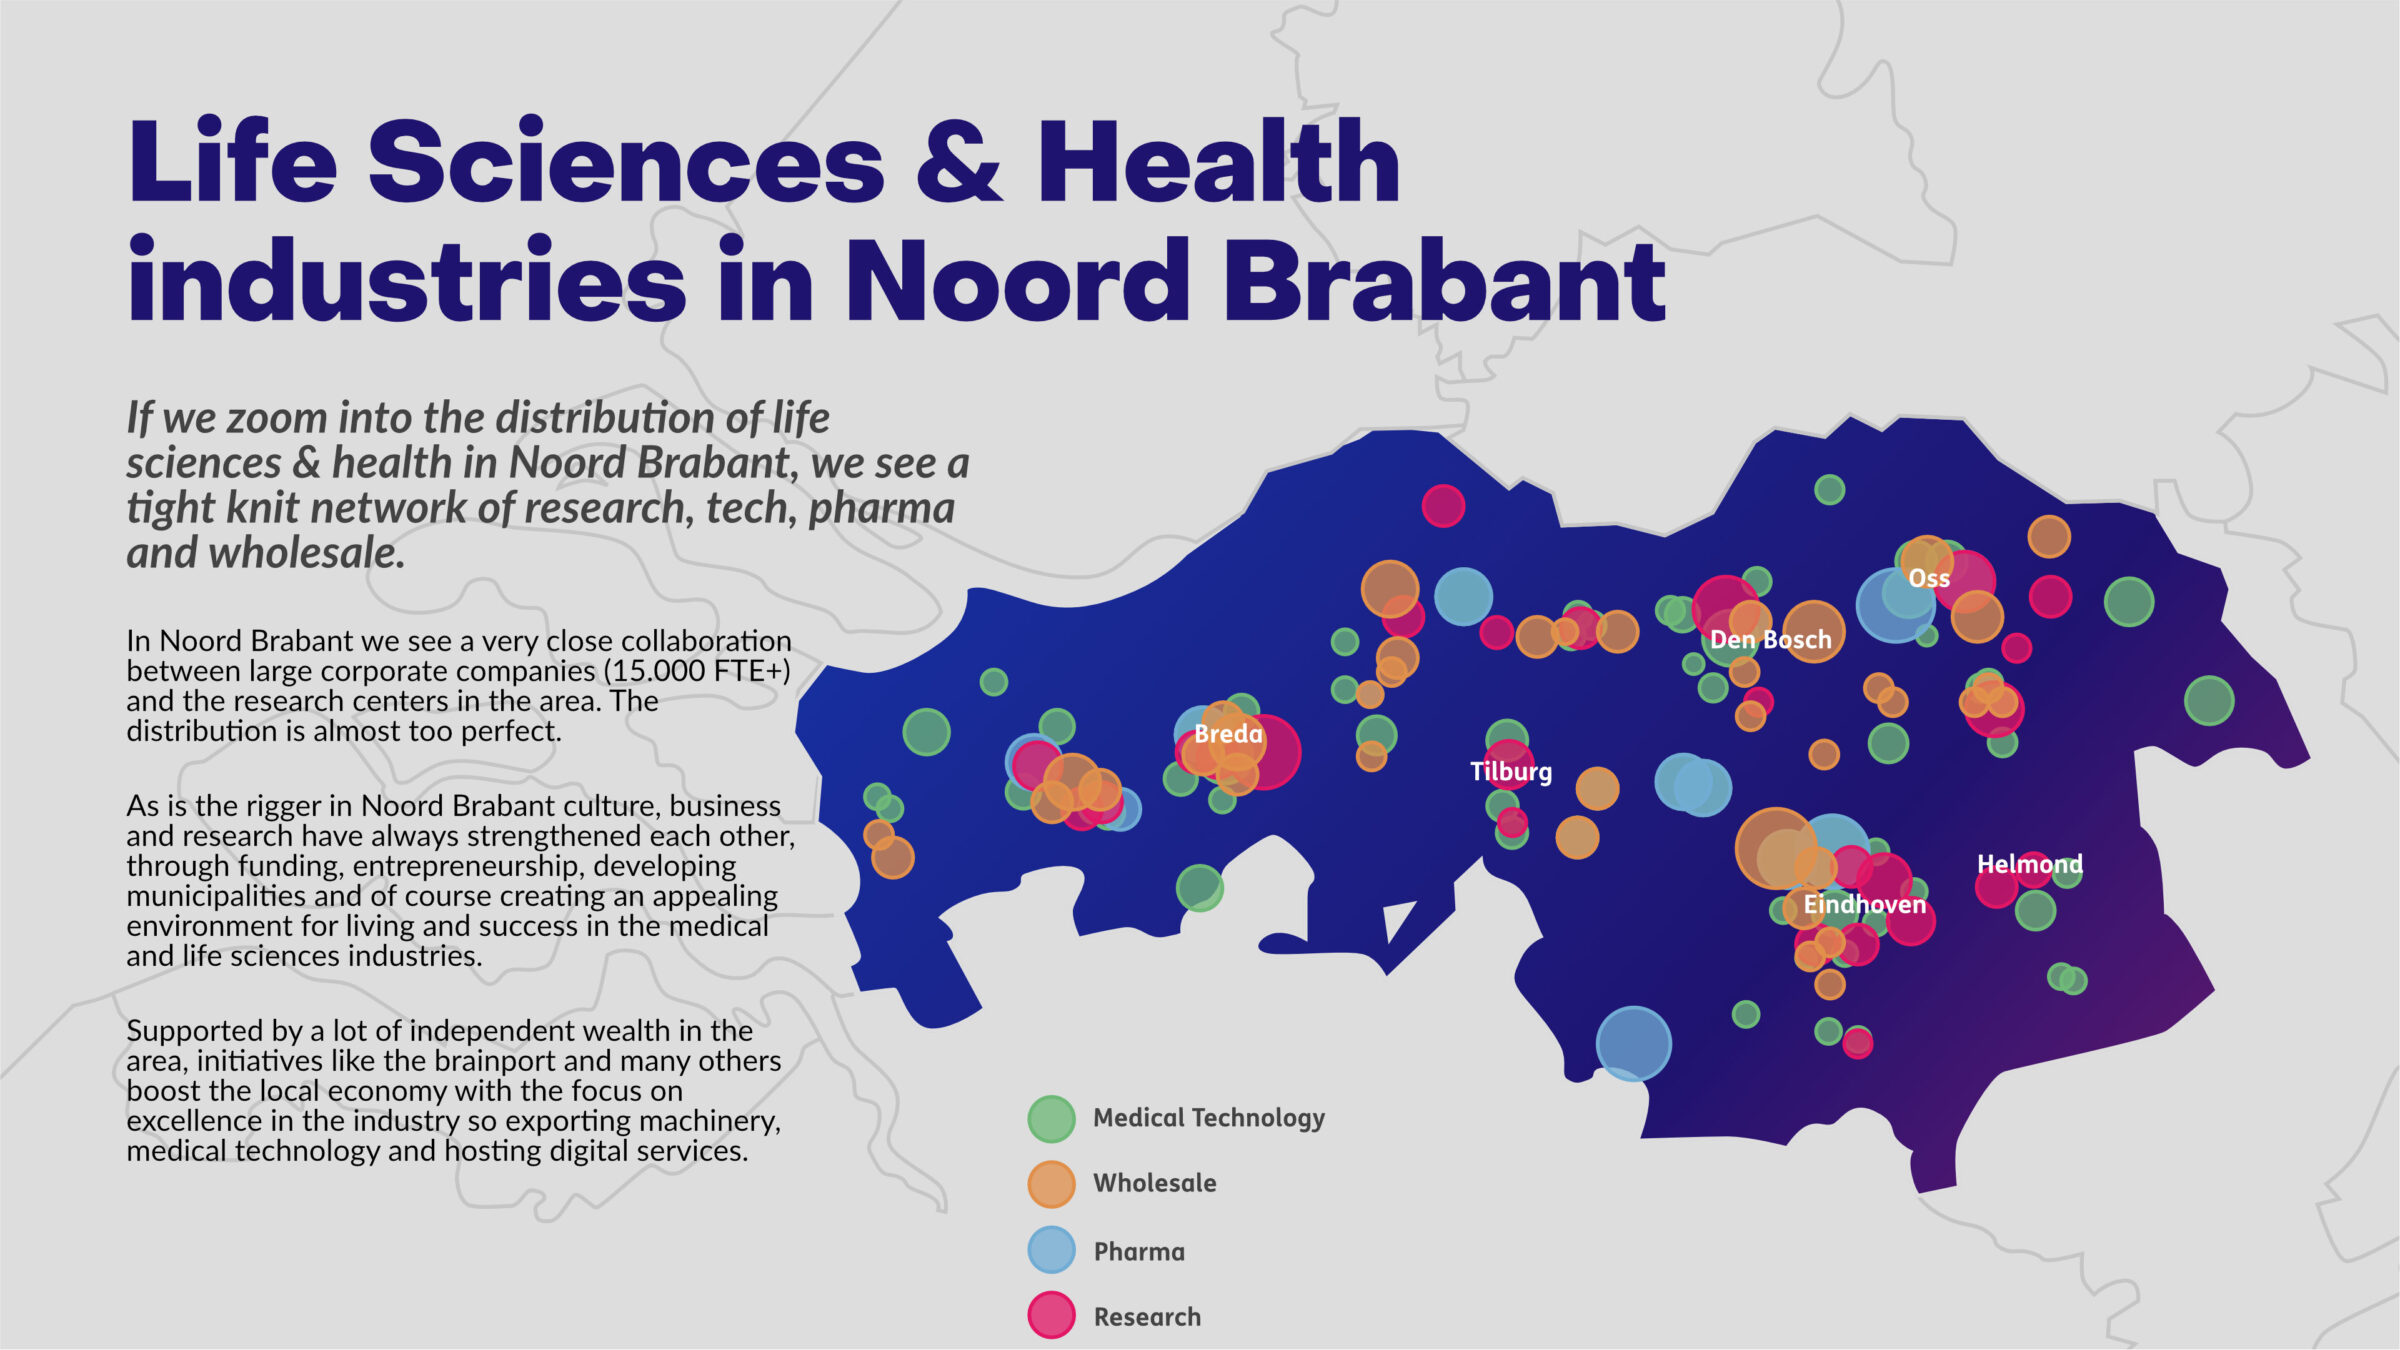
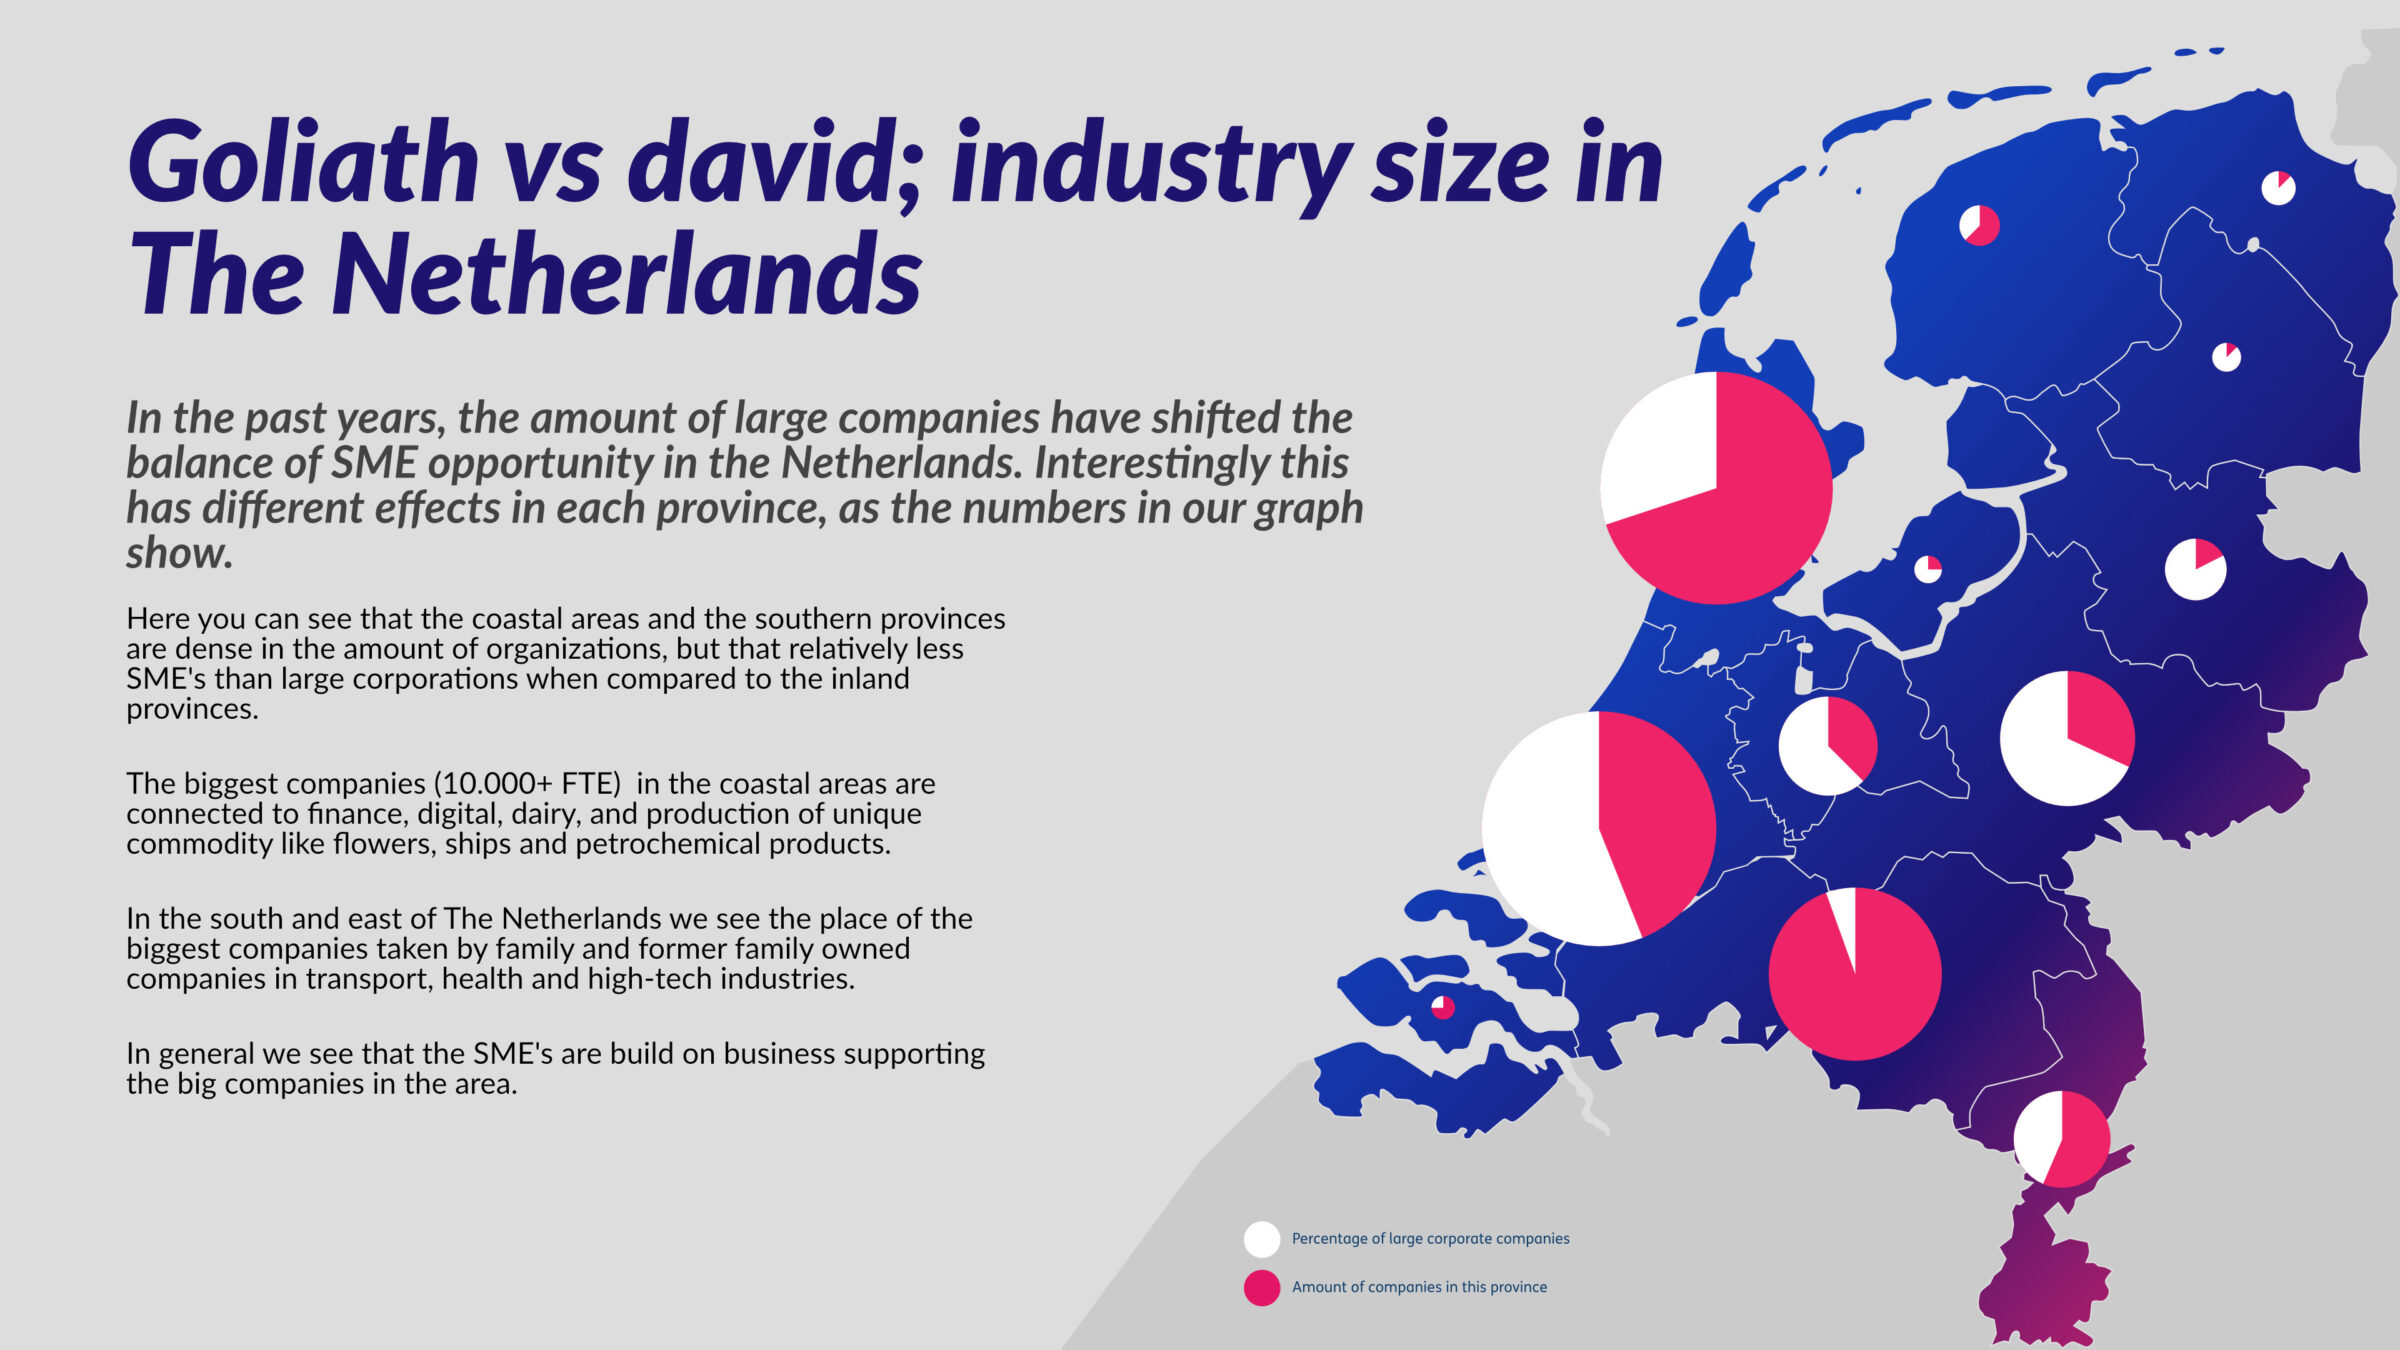
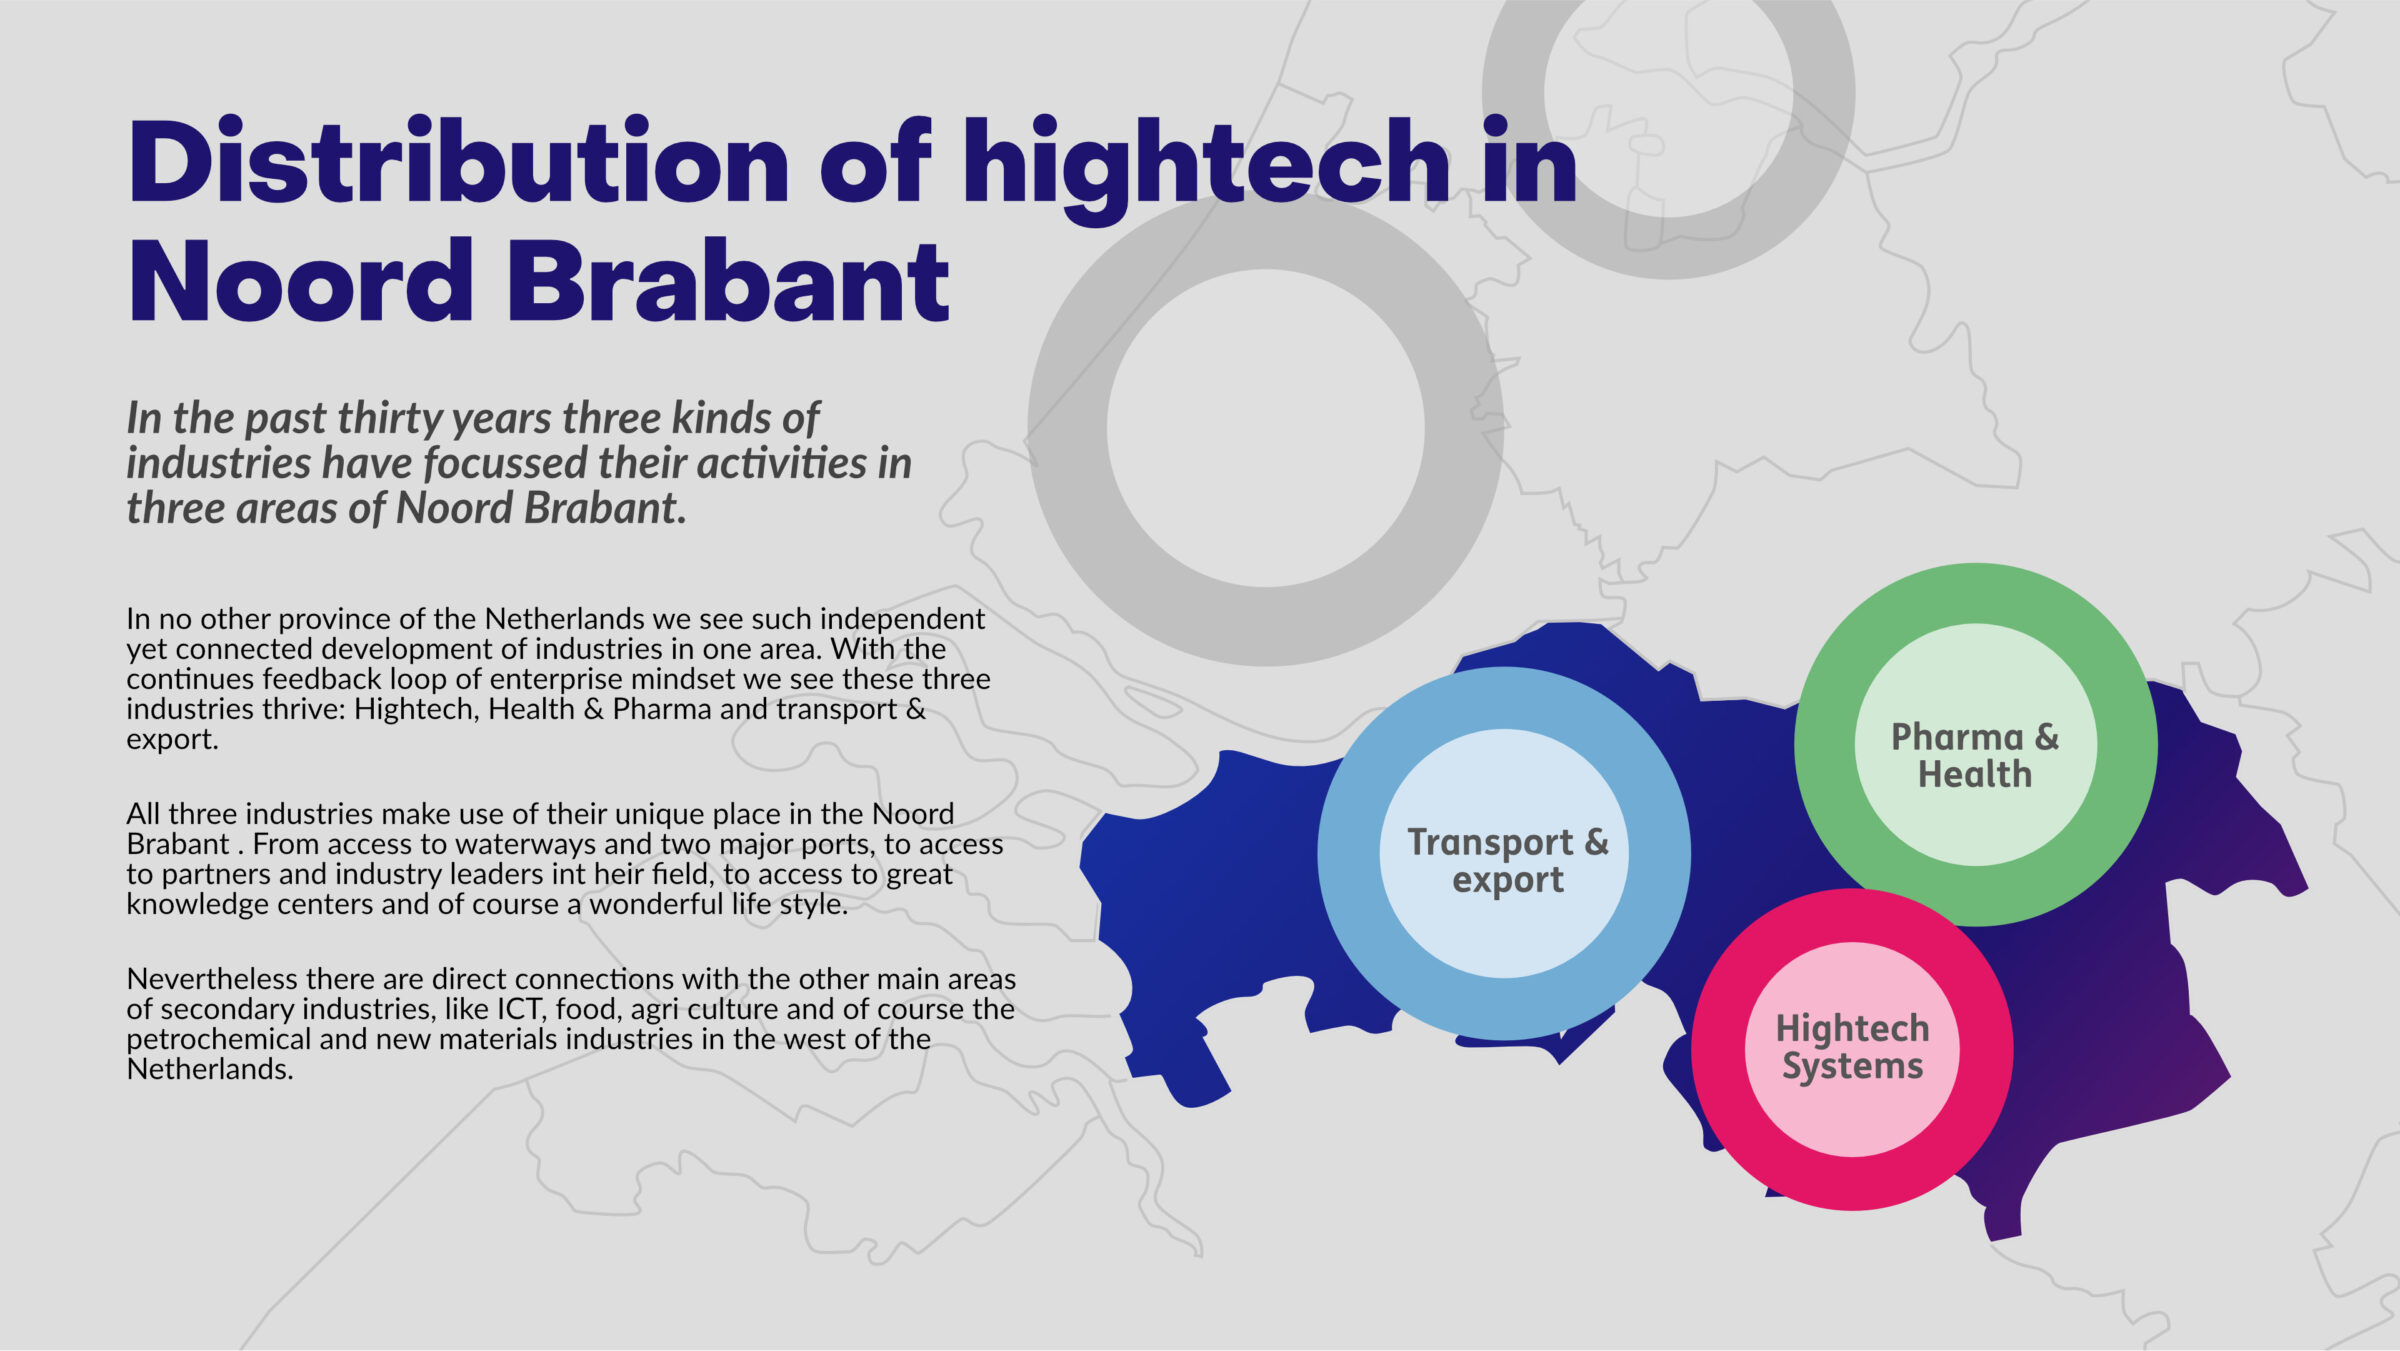
To create good policy, you need to understand what is happening, what the cause is, and for that, you need data. Unfortunately, much data is hidden in databases, reports and unconnected data lakes. It can be challenging to turn these data into insights. Data engineering, economic knowledge and storytelling helps with this, particularly by visualizing information so that insights come naturally.

For this you need a data team, design strategists, economists, and data storytellers. This series of illustrations served as a starting point to structure teams within a research organization into a policy and strategy advisory organization. Insights that were previously missed due to time, focus, and vision are now preemptively offered to national governments to support, substantiate, and provide policy with visible results.

Think of the explanatory videos by NOS on YouTube, but aimed at policymakers, secretary-generals, ministers, and journalists—only interactive, so they can see how their policy has had, is having, or could have an impact over time, geography, and different aspects of an issue.

The department could also, among other things, create different projections using economic models, AI projections, and those from expert organizations such as CBS, TNO, and more.
